|
1. Enable Traffic Audit Choose One-Device>Gateway->Real time Traffic and enable it. 2. Viewing Real-Time Traffic Choose One-Device > Gateway > Monitor. Click More to the right of Traffic Trend to access the gateway's monitoring details page. On the page that is displayed, click the Real-time Traffic tab. 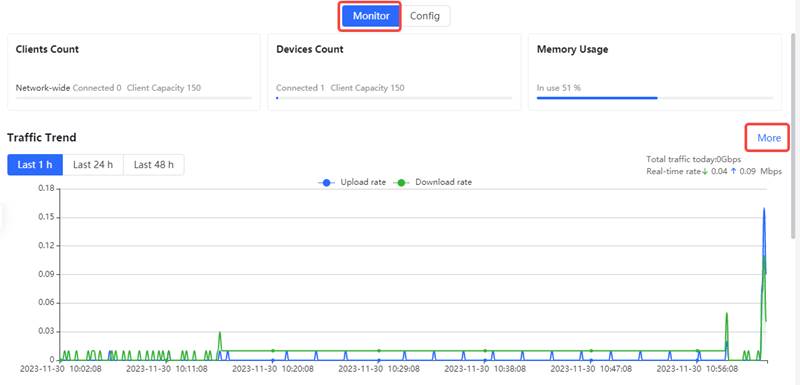 Select a refresh frequency to set the frequency of real-time traffic refresh. 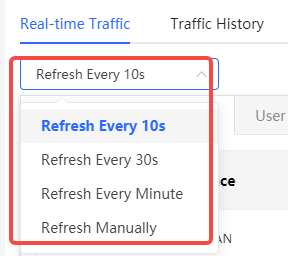 2.1 Viewing Real-time Traffic of an Interface Click the Interface Real-Time Traffic tab to view the uplink or downlink traffic of an interface or the entire device. 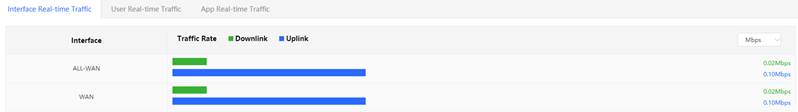 2.3 View traffic in the recent one hour Select an interface or ALL-WAN in the Interface drop-down menu. You can view the traffic and sessions of the interface or device in the last one hour, including the sessions of the excluded WAN port. 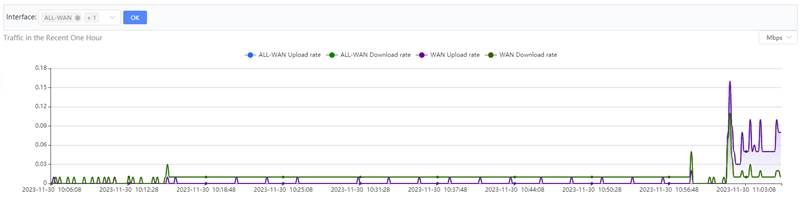 Note Uplink traffic and downlink traffic are color-coded in the figure. You can move the cursor over a curve to view uplink traffic and downlink traffic at a certain time.2.4 View the number of sessions and half-open connections in the last one hour Select an interface or ALL-WAN in the Interface drop-down menu to check the number of sessions and half-open connections in the last one hour (including the session information of the excluded WAN port). 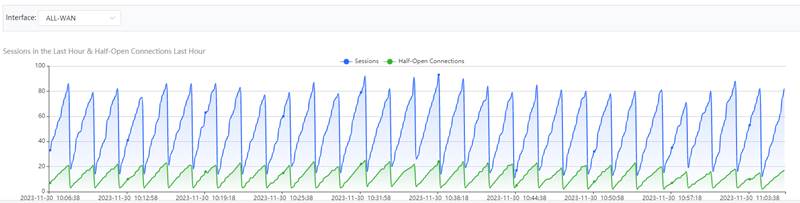 2.5. Viewing Real-time Traffic of a Client Click the User Real-Time Traffic tab to view the IP address, name, online duration, number of sessions, and uplink and downlink traffic of each client. If there are multiple clients, the system displays traffic data by downlink traffic in descending order by default. The sorting mode can be switched based on uplink traffic or downlink traffic. You can set the traffic unit, number of items to be displayed on the current page, paging display, and other functions based on service requirements. 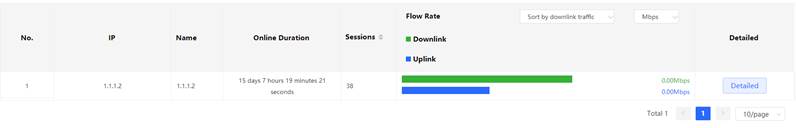 Click Detailed. The system displays the uplink and downlink traffic rates of various applications used by the current client. You can set the sorting mode (by downlink traffic or uplink traffic), unit, and other parameters based on service requirements. NoteTo view real-time traffic of a client, ensure that the Traffic Audit function is enabled on the App Real-time Traffic page. 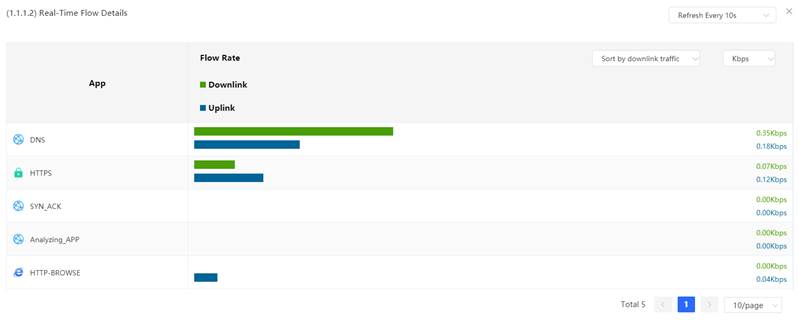 2.6. Viewing Real-time Traffic of an App Click the App Real-Time Traffic tab and enable Traffic Audit. You can view the name, application group, uplink traffic, and downlink traffic of each app. If there are multiple apps, the system displays traffic data by downlink traffic in descending order by default. The sorting mode can be switched based on uplink traffic or downlink traffic. You can set the traffic unit, number of items to be displayed on the current page, paging display, and other functions based on service requirements. 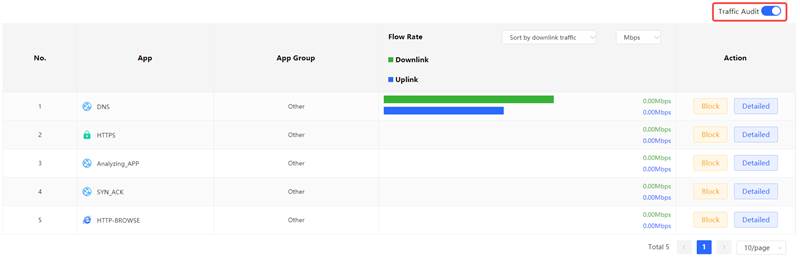 Click Detailed. The details of the traffic used by each user of the current application are displayed in the pop-up dialog box. You can set the sorting mode (by downlink traffic or uplink traffic), unit, and other parameters based on service requirements. 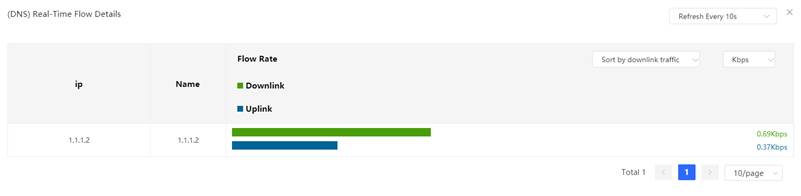 Click Block. In the displayed message, click OK to block the corresponding application. 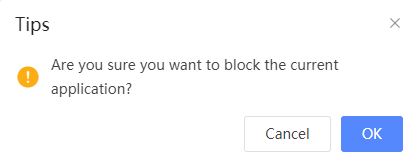 3. Viewing Historical Traffic Choose One-Device > Gateway > Monitor. Click More to the right of the Traffic Trend tab. On the gateway monitoring details page, click the Traffic History tab. Select a refresh frequency to set the frequency of historical traffic refresh. 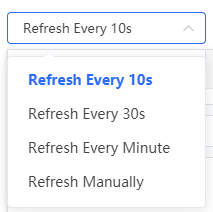 3.1.Viewing Historical Traffic of an Interface (1) Click the Traffic History tab. (2) Select an interface or ALL-WAN in the Interface drop-down menu. (3) Select a time range. (4) The system displays historical traffic, session, and half-open connection statistics of an interface or the device within a specified period. 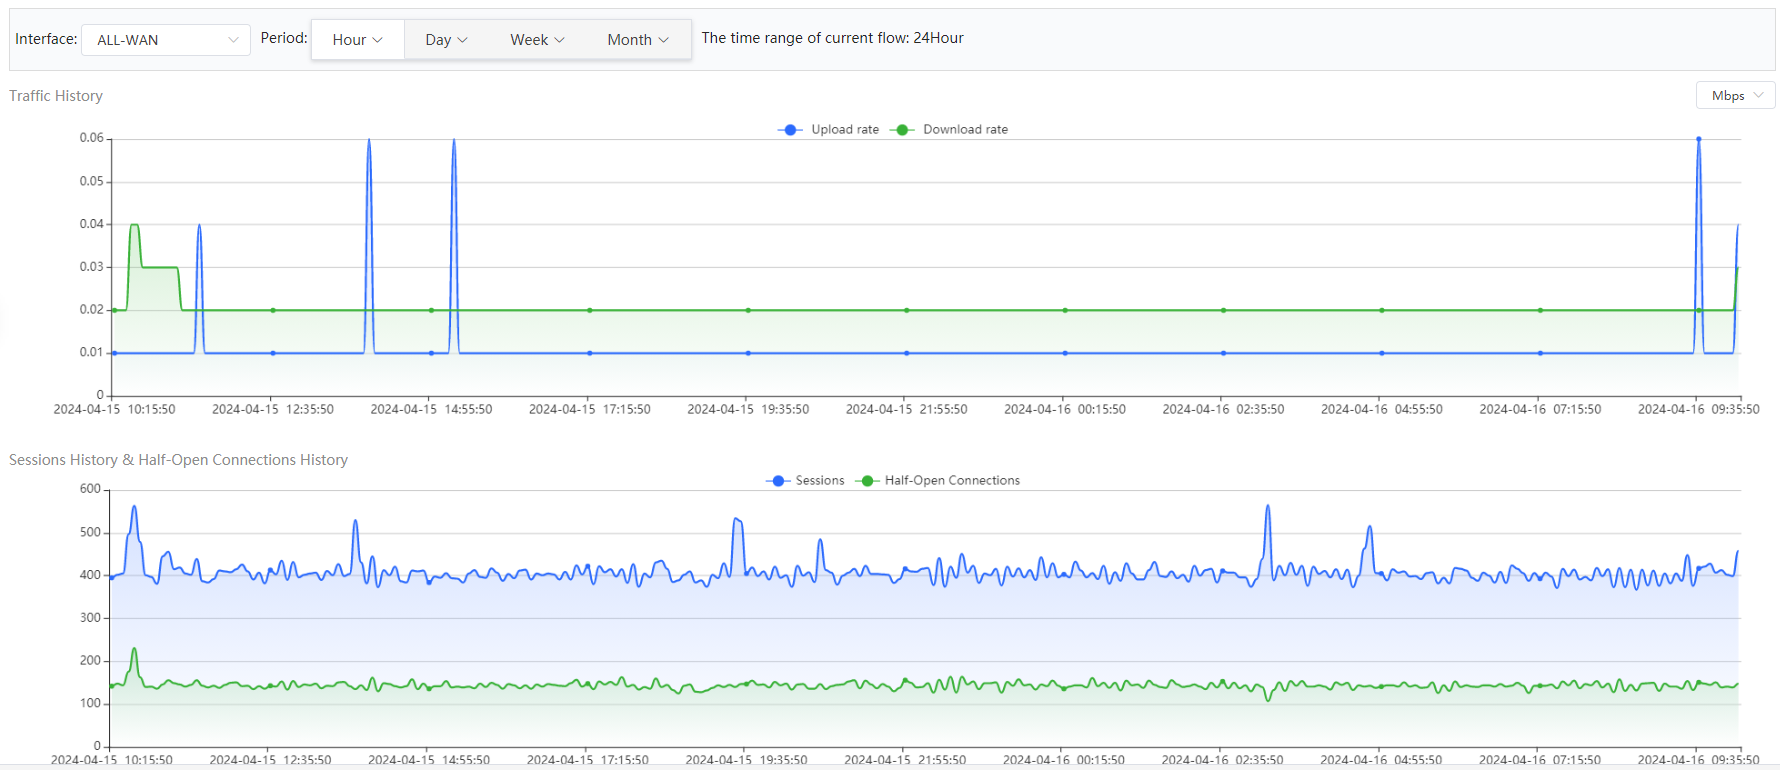 Note NoteUplink traffic and downlink traffic are color-coded in the figure. You can move the cursor over a curve to view uplink traffic and downlink traffic at a certain time. 3.2 View Historical Traffic of a Client Click the User Traffic History tab. Select a time range. You can view historical traffic data of clients today or this week on the User Traffic History page. If there are multiple clients, the system displays the traffic data by downlink traffic in descending order by default. You can view the online duration, uplink traffic, and downlink traffic of each client in the time span. The sorting mode can be switched based on the uplink traffic or downlink traffic. You can set the traffic unit, number of items to be displayed on the current page, paging display, and other functions based on service requirements. 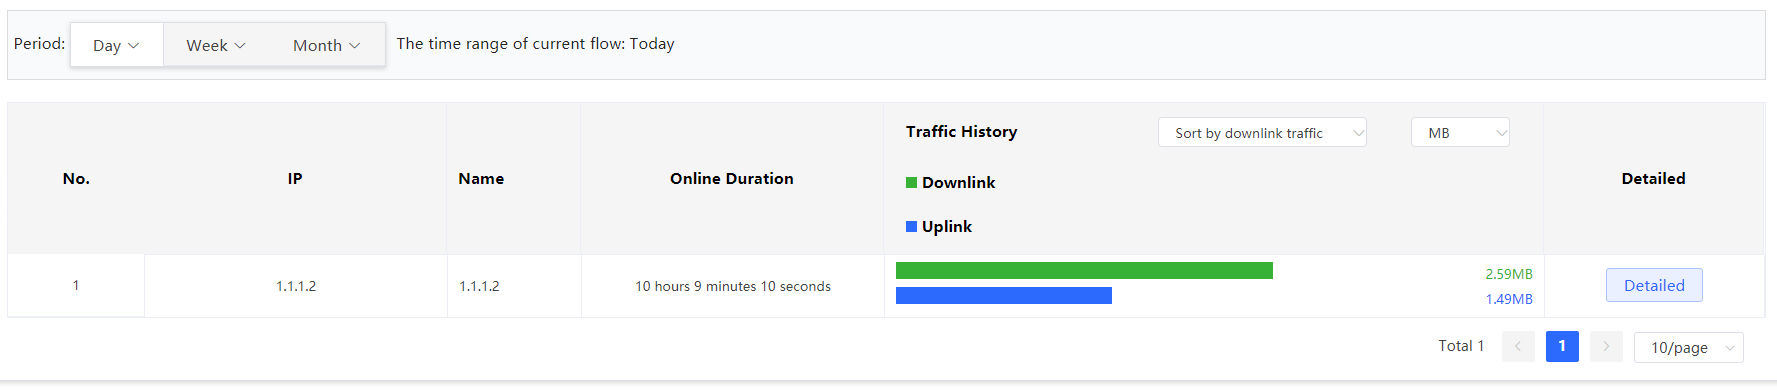 Click Detailed. The details of the current client's app usage, including the traffic size and online duration, are displayed in a pop-up dialog box. You can set the sorting mode (by downlink traffic or uplink traffic), unit, and other parameters based on service requirements. Note To view historical traffic of a client, ensure that the Traffic Audit function is enabled on the App Real-Time Traffic page. 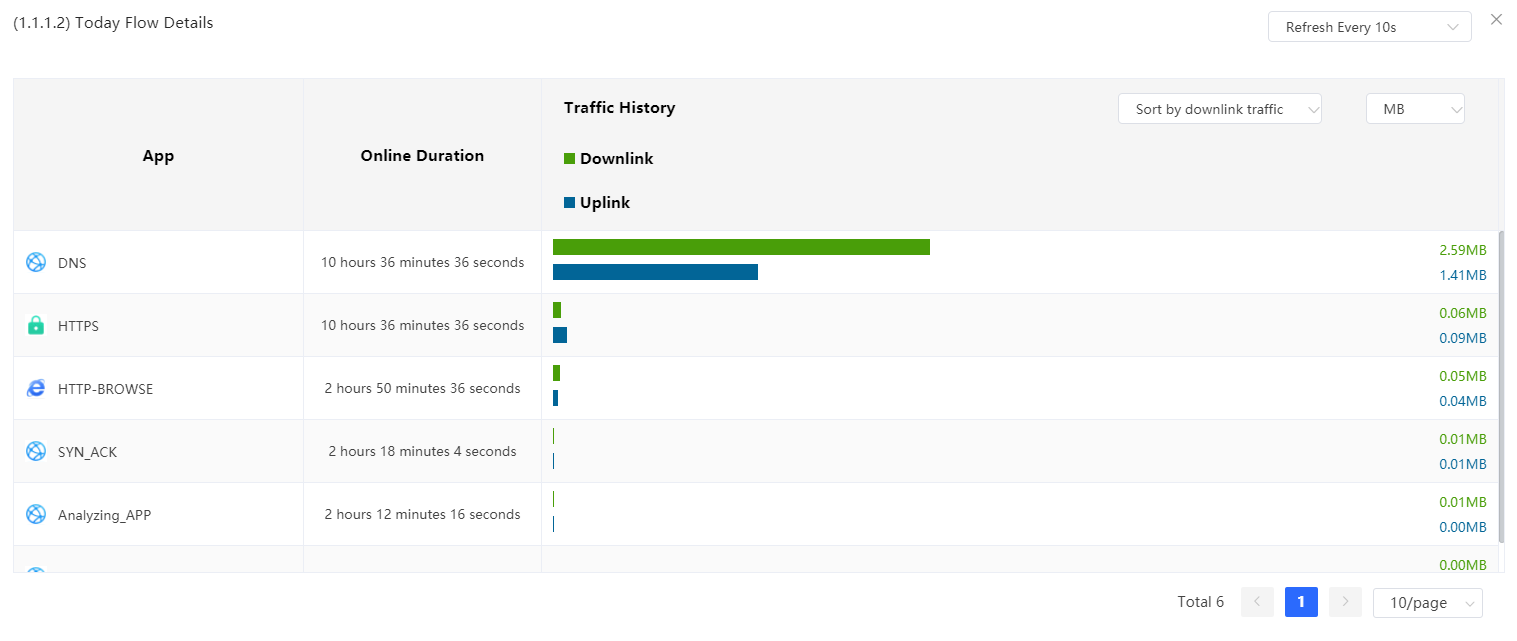 3.3.View Historical Traffic of an App Click the Traffic History tab, enable the Traffic Audit function, and view the application historical traffic. Note The status of Traffic Audit switch is consistent with that on the App Real-Time Traffic page. After it is enabled, the App Real-Time Traffic function and App History Traffic function are enabled. On the App History Traffic page, you can view historical traffic of an application today or this week. If there are multiple applications, the system displays traffic data by downlink traffic in descending order by default. You can view the name, application group, uplink traffic, and downlink traffic of each application in the time span. The sorting mode can be switched based on uplink traffic or downlink traffic. You can set the traffic unit, number of items to be displayed on the current page, paging display, and other functions based on service requirements. 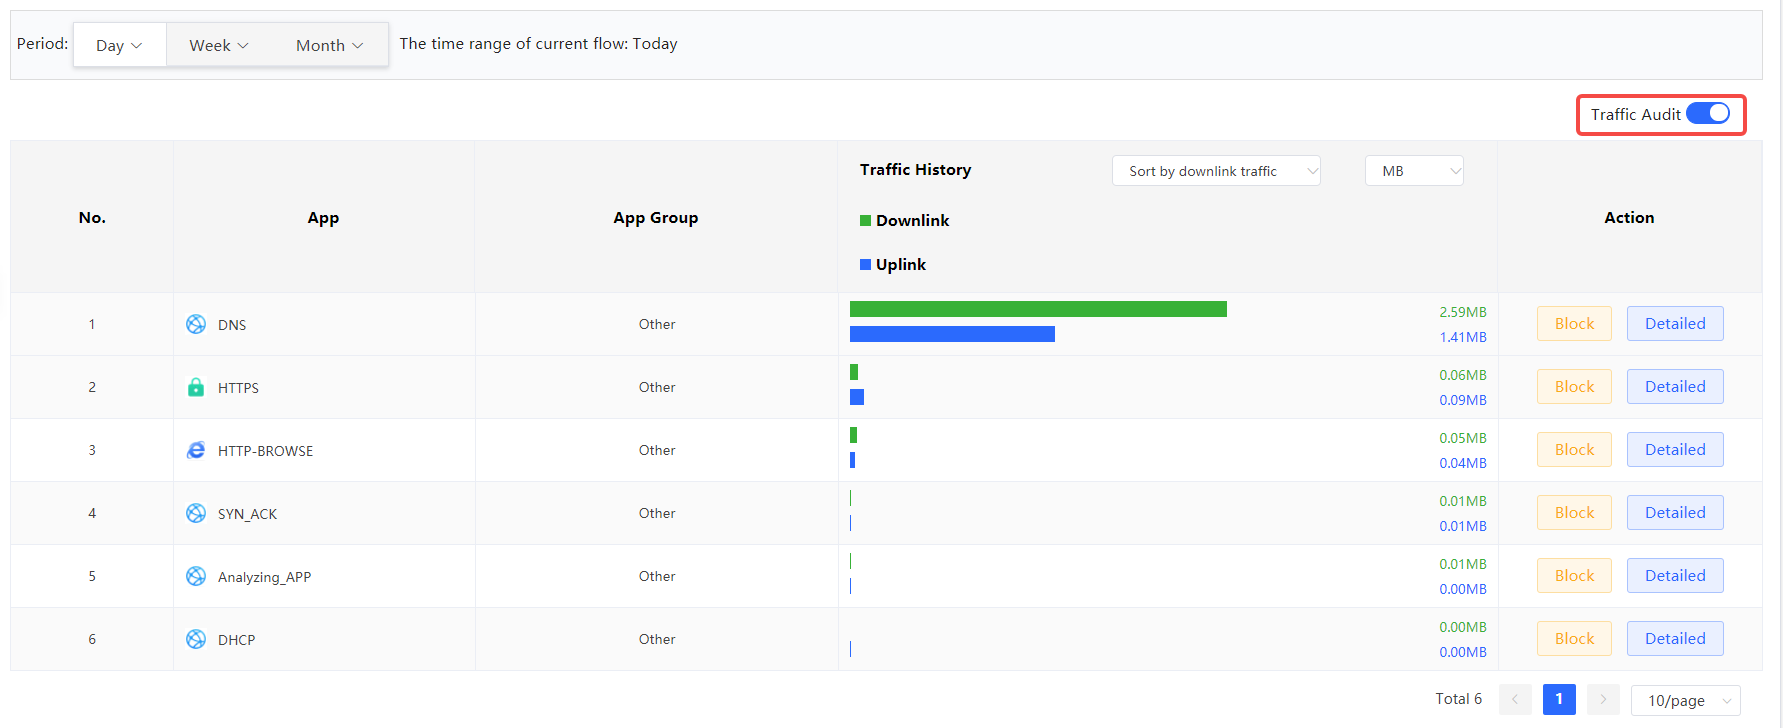 Click Detailed. The system displays details about the traffic used by each client of the current application in a pop-up dialog box. You can set the sorting mode (by downlink traffic or uplink traffic), unit, and other parameters based on service requirements. 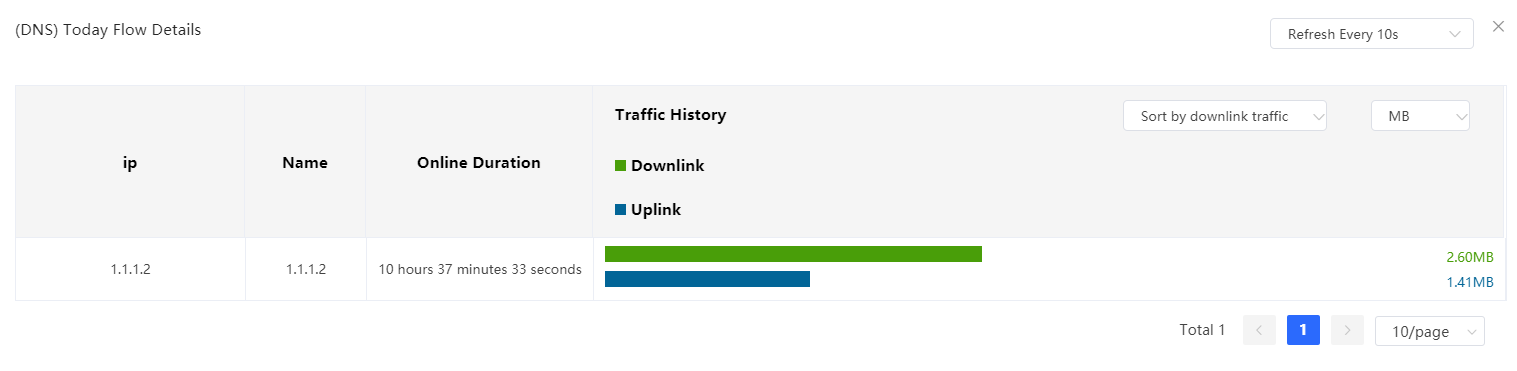 Click Block. In the displayed message, click OK to block the corresponding application.  |
This site contains user submitted content, comments and opinions and is for informational purposes only. Ruijie may provide or recommend responses as a possible solution based on the information provided; every potential issue may involve several factors not detailed in the conversations captured in an electronic forum and Ruijie can therefore provide no guarantee as to the efficacy of any proposed solutions on the community forums. Ruijie disclaims any and all liability for the acts, omissions and conduct of any third parties in connection with or related to your use of the site. All postings and use of the content on this site are subject to the Ruijie Community Terms of Use.
More ways to get help: Visit Support Videos, call us via Service Hotline, Facebook or Live Chat.
©2000-2023 Ruijie Networks Co,Ltd

 Level 5


